Back
11 Mar 2020
WTI Price Analysis: Escalates recovery moves to fill the gap below $41.20
- WTI extends pullback from the multi-year low.
- 100-HMA, 61.8% of Fibonacci retracement can offer intermediate halts to revisit the previous week’s closing.
- An ascending trend line since Monday limits immediate downside.
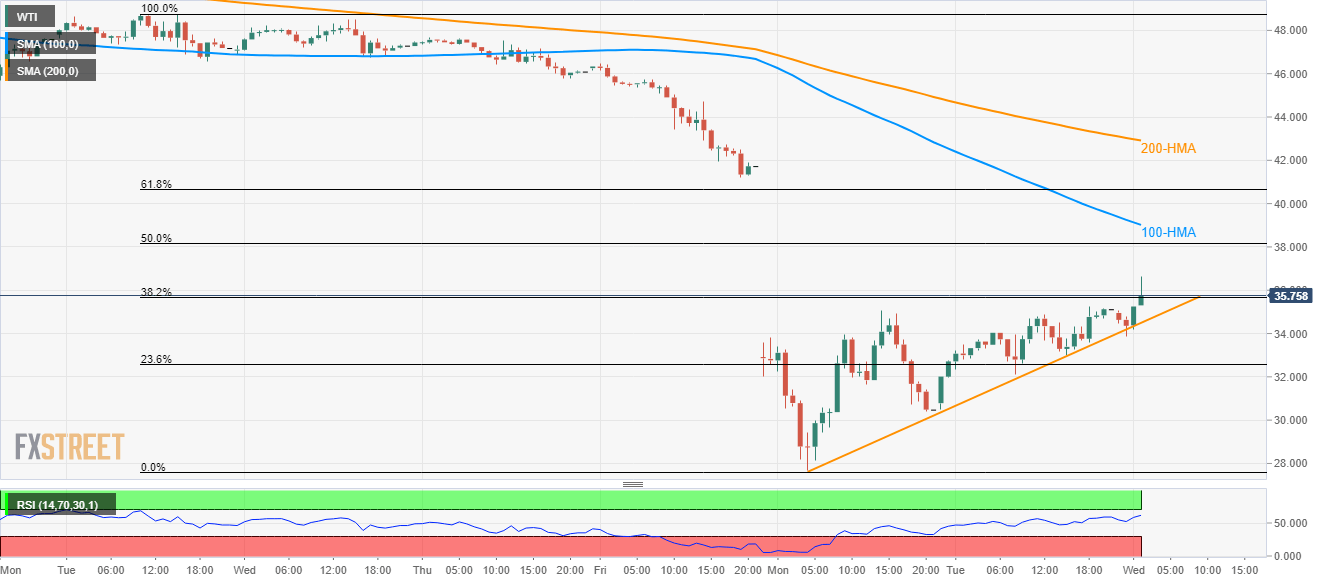
While following a short-term rising trend line from Monday, WTI takes the bids to $35.70 during the Asian session on Wednesday.
In doing so, the energy benchmark rises towards filling the week-start gap below $41.20. However, 100-Hour Simple Moving Average (HMA) near $39.00 can act as immediate resistance.
Following that 61.8% Fibonacci retracement of the black gold’s monthly declines, at $40.65 can act as an additional upside barrier.
It should, however, be noted that a 200-HMA level of $42.90 can challenge the oil price recovery beyond $41.20.
Meanwhile, a sustained decline below the immediate support line of $34.50 can take rest near $30.00 ahead of challenging the previous week’s low surrounding $28.80.
WTI hourly chart

Trend: Further recovery expected
