Back
10 Mar 2020
WTI Price Analysis: Buyers will look for entry beyond $42.60
- WTI recovers losses from the multi-year low.
- December 2018 low, 38.2% Fibonacci retracement acts as short-term key resistance.
- Fresh selling can print new low under $27.70.
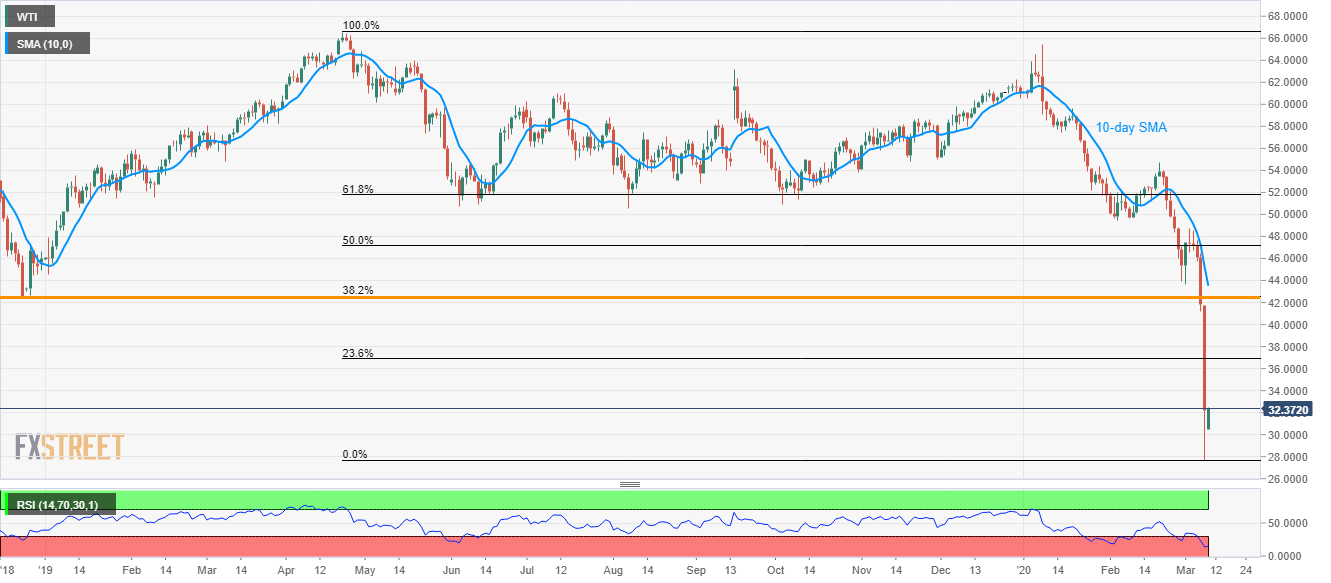
Having marked a flash crash of more than 20%, WTI retraces to $32.37 during Tuesday’s Asian session.
While the recent recovery gains support from oversold RSI, buyers will wait for entry unless the black gold crosses December 2018 low and 38.2% Fibonacci retracement of its fall from early 2019, around $42.60.
In doing so, 10-day SMA near $43.50 and 50% Fibonacci retracement near $47.20 will entertain the buyers ahead of pleasing them with the monthly top surrounding $48.75.
Alternatively, the intra-day low near $30.50 and $30.00 round-figure may offer small rests to the energy benchmark during the fresh declines.
However, any further downside might not hesitate to slip beneath $27.70.
WTI daily chart
Trend: Pullback expected