Back
19 Feb 2020
GBP/USD Price Analysis: Pound trading near four-day lows, sub-1.3000 level
- GBP/USD is trading on the back foot as bulls didn’t manage to keep the market above 1.3000 figure.
- The level to beat for sellers is the 1.2952 support.
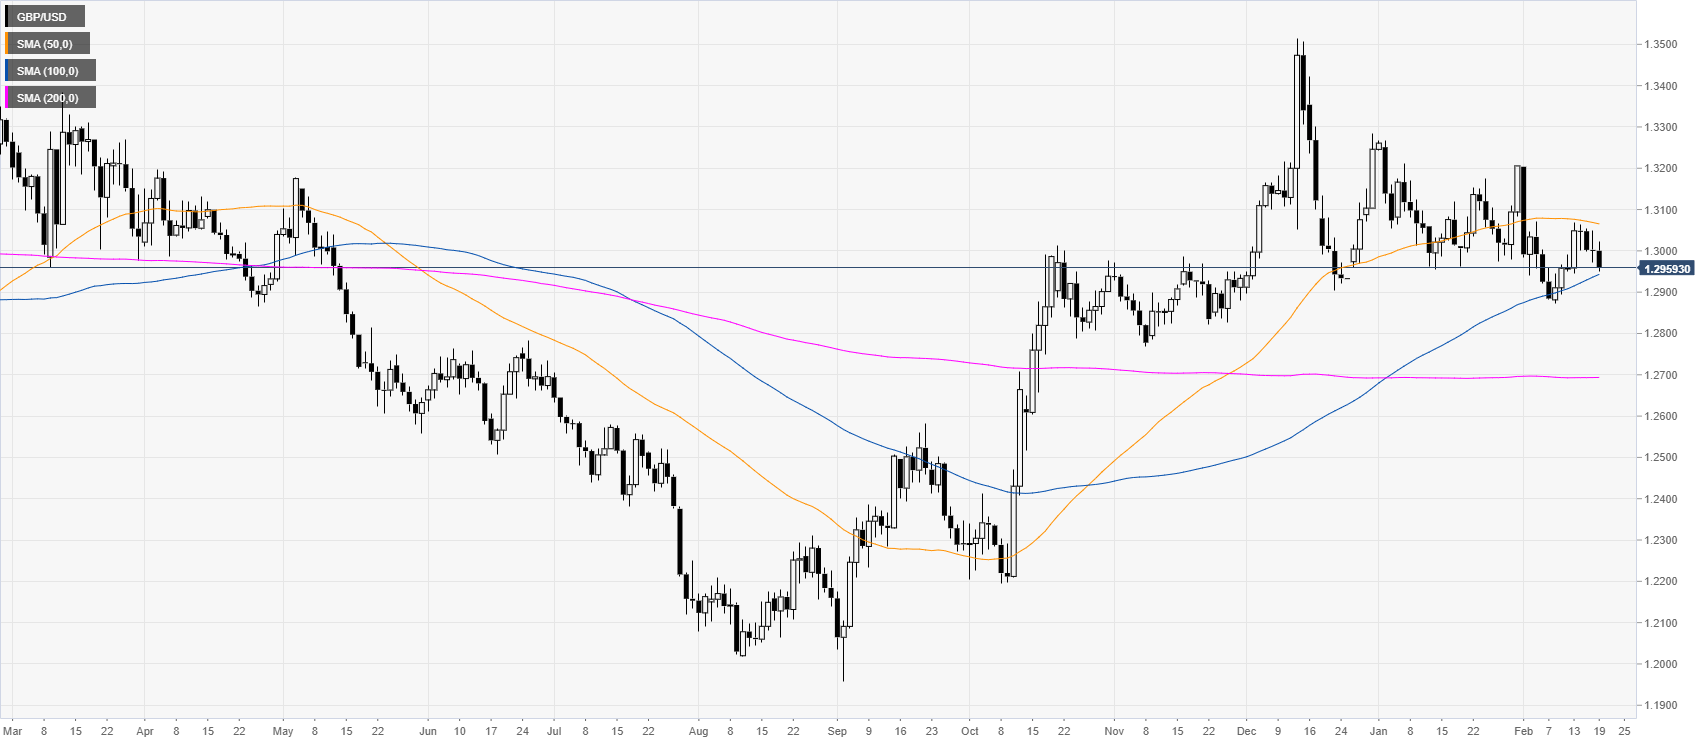
GBP/USD daily chart
After the October and December bull-market, GBP/USD is trading in a rectangle consolidation above its 100/200-day simple moving averages (SMAs).
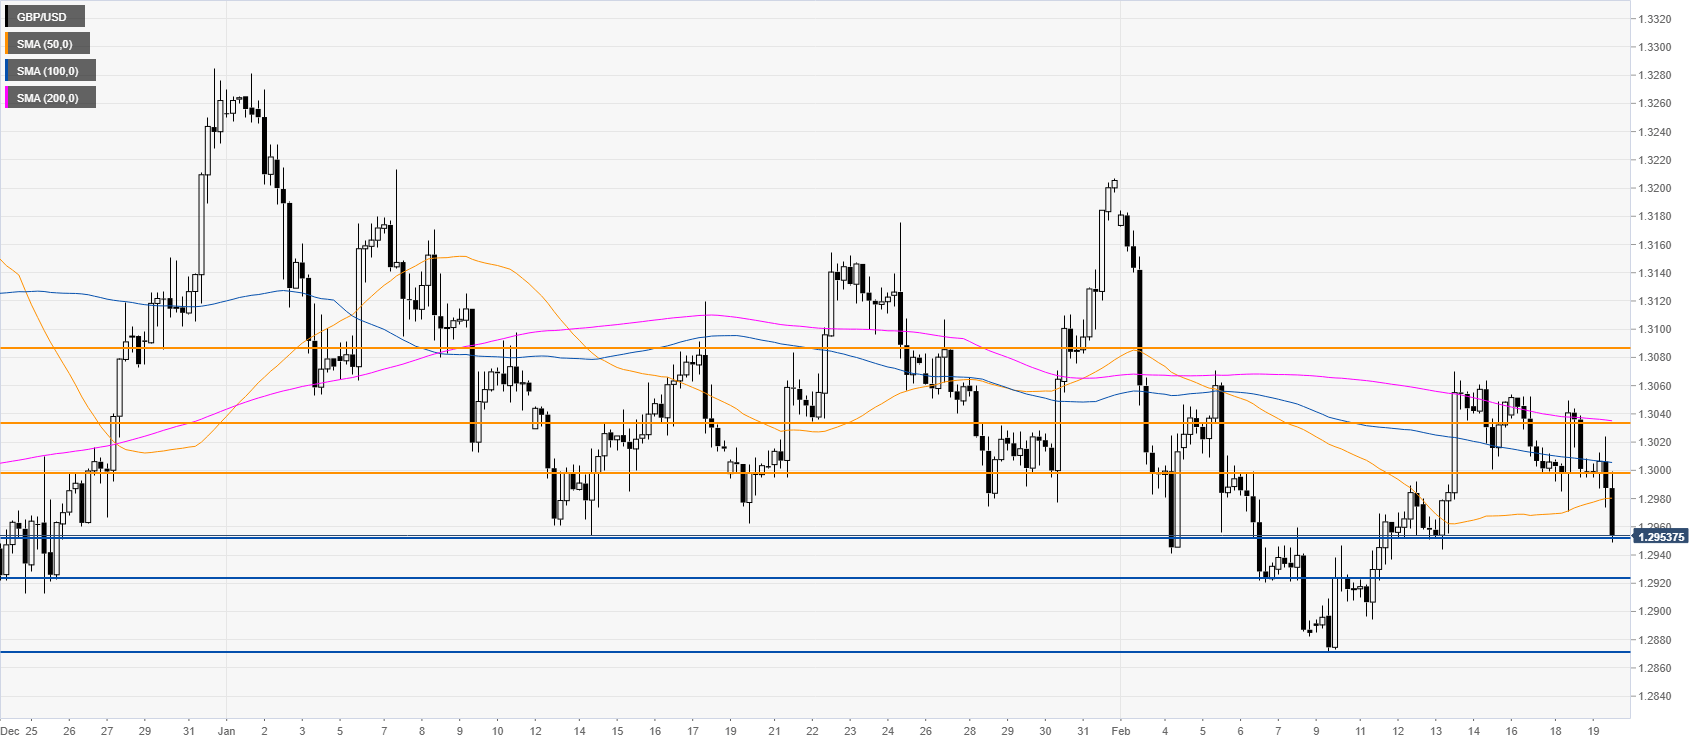
GBP/USD four-hour chart
The pound is pressuring the 1.2952 support while trading below the main SMAs. Bulls waited their chance to keep the market above the 1.3000 figure and sellers are taking the lead. A break below the 1.2952 level should lead to extra losses towards the 1.2925 and 1.2872 levels, according to the Technical Confluences Indicator. Resistances are seen near the 1.3000, 1.3033 and 1.3087 levels.
Resistance: 1.3000, 1.3033, 1.3087
Support: 1.2952, 1.2925, 1.2872
Additional key levels