Back


3 Feb 2020
GBP/USD Price Analysis: Pound dropping sharply, nearing 1.3000 figure
- The market is in search of a clear direction.
- The level to beat for sellers is the 1.2973 level.
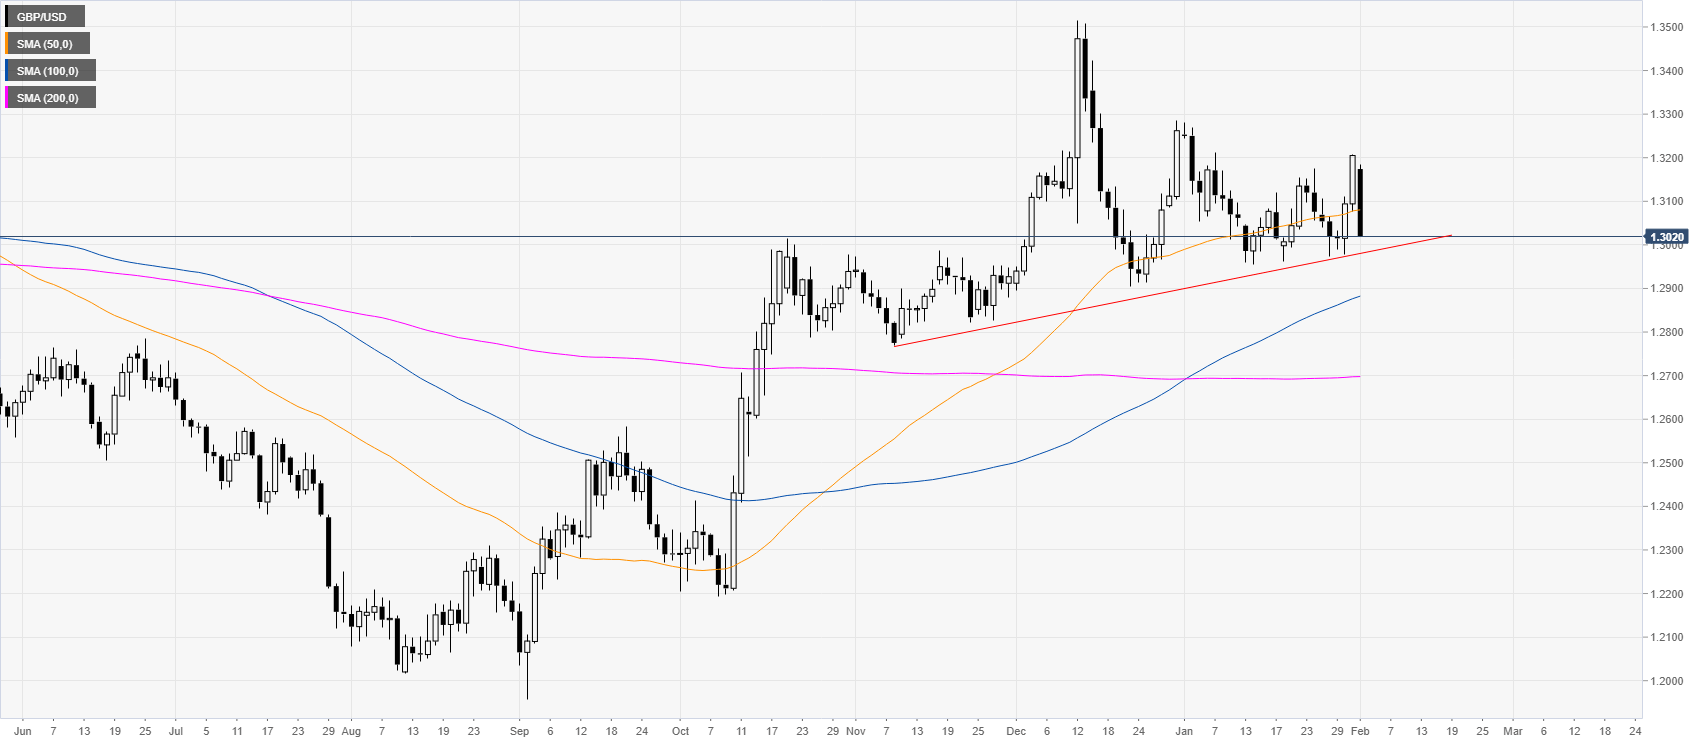
GBP/USD daily chart
The market is essentially ranging above the 100/200-day simple moving averages (SMAs) and an ascending trendline.

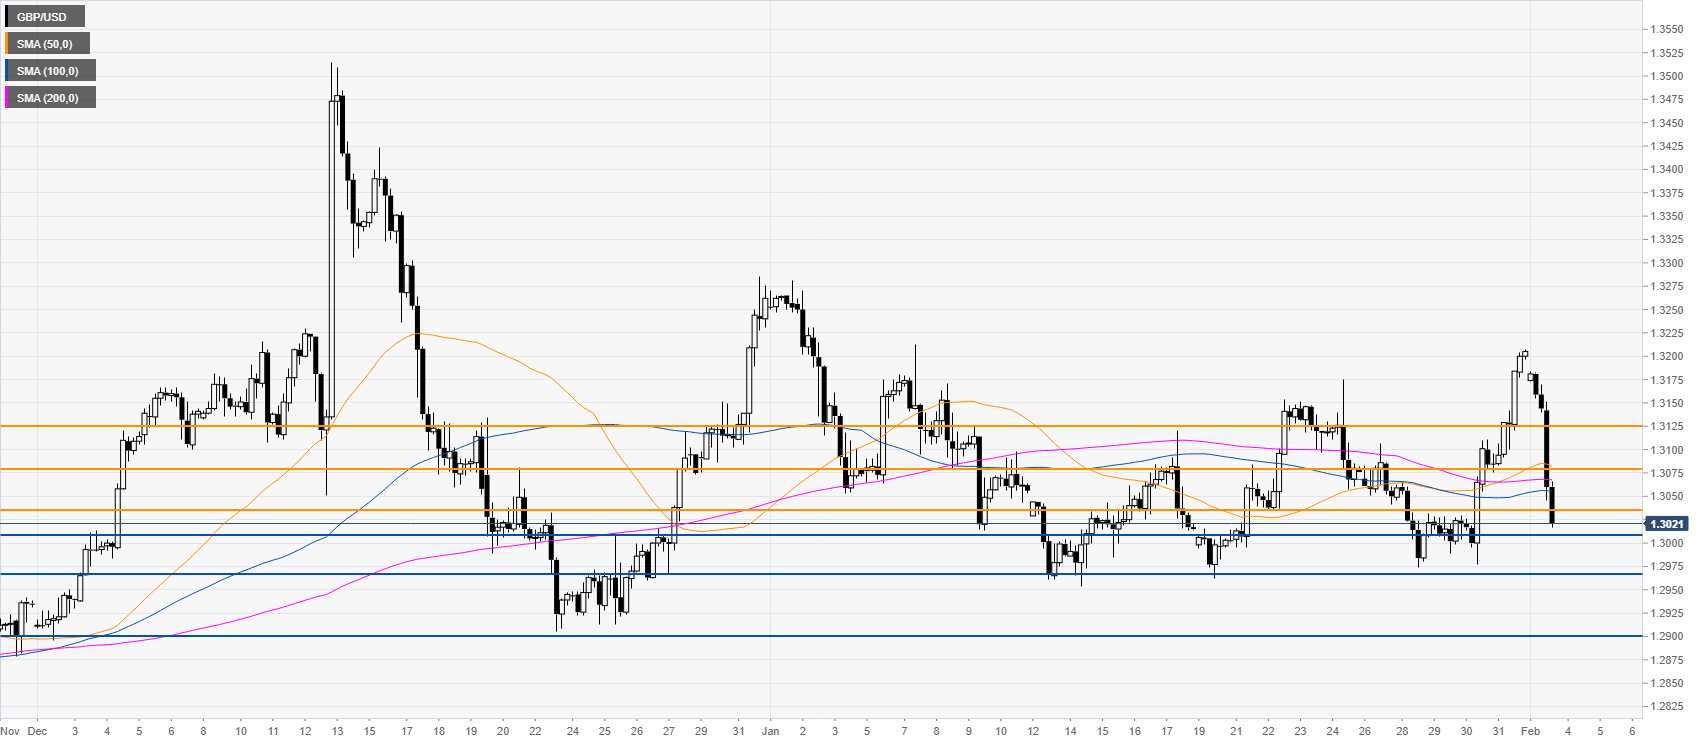
GBP/USD four-hour chart
The pound is dropping sharply from the upper range of the last month of trading. Bears are likely back in control and a break below the 1.3010 support can lead to the 1.2967 and 1.2900 levels, according to the Technical Confluences Indicator. Resistances are seen near the 1.3035, 1.3080 and 1.3129 levels.

Resistance: 1.3035, 1.3080, 1.3129
Support: 1.3010, 1.2967, 1.2900
Additional key levels
